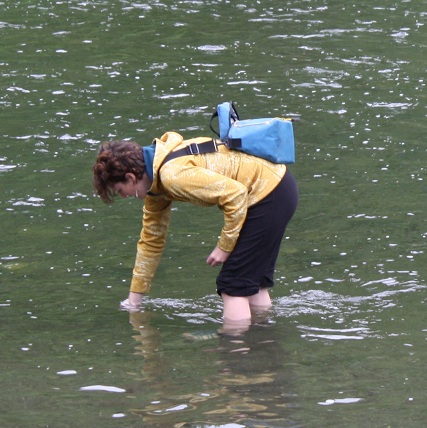
Water quality monitoring plays an important role in keeping watershed residents informed about water quality issues, and informing and inspiring action on behalf of our watershed health. This valuable data has the power to influence pollution reduction actions and shape public policy. You can learn more about the program below.
The Central Vermont Regional Planning Commission has created an interactive web map that you can use to explore our watershed, and learn more about FWR's water quality data. Click here to check it out.
Friends of the Winooski River has been collecting samples primarily in the capital area and the Winooski River headwaters -- you can read technical reports on these efforts, on the right side of this page.
Friends of the Mad River coordinates the Mad River Watch program, collecting data on swimming holes throughout their subwatershed of the Winooski: click here to learn more.
The Huntington River Conservation Partnership also monitors swimming areas in their subwatershed: click here to learn more.
Winooski Natural Resources Conservation District manages the Rethink Runoff Stream Team, supporting outreach efforts for certain Chittenden County municipalities, including water quality monitoring: click here to learn more.
We look at different things at different sites, depending on what concerns are associated with the location. There are a couple of basic resources that identify concerns in streams in Vermont, which are a good starting place for thinking about monitoring. One is the biannual list of "Impaired Waters" which you can look at by clicking here. Another, more specific to the Winooski watershed, is the Tactical Basin Plan for our basin (another word for watershed -- Winooski is Basin 8 in the State's system): click here to read the most recent TBP.
The most common pollutants of concern in the streams we sample are phosphorus and chloride.
Want to get involved in a great hands-on project? Volunteers collect stream samples on a biweekly basis throughout the summer in the Cabot/Marshfield/Plainfield and Barre/Montpelier areas. These samples are then sent to a lab and analyzed to determine chloride, phosphorus, nitrogen, and turbidity levels.
Sampling takes about 15 minutes per site, and volunteers can collect samples from one or more sites. No experience necessary and training is provided. We collect samples six times over the course of the summer. Volunteers can choose to sample on one or all of the sampling dates.
Please sign up using the
Thanks to our water quality monitoring volunteers!
Emily Ahtunan, Nick, Jay, & Ethan Borlund, Suzanne & Simon Eikenberry, Steve Fiske, Gary Gulka, Kaitlin Hayes, Roger Kokodyniac, Doug LaPointe, David Lowther & Jean, Marisol, & Elli McDowell, Isaac & Jamie Maddox-White, Laura & Mikaela Moore, Lyn and Nancy Munno, Gianna Petito, Julianna Plumber, George Springston, Jen & Indy Roberts, Jeff Schumann, Jason & Miriam Serota-Winston, Jennifer Skinder, Leif Richarson, & Benjamin Richardson-Skinder, Brian Slopey, Jeff Schumann, Janice Walrafen, Bruce Westcott, and Jan Zemba.

2019 Headwaters Report
2018 Headwaters Report
2017 Headwaters Report
2016 Headwaters Report
2015 Headwaters Report
2007-2014 Available upon request
Including sites on the Winooski, Stevens Branch, Gunners Brook, Thatcher Brook, Little River, Dog River, North Branch, etc.
2023 Mid-Winooski Watershed Streams and Rivers
2022 Mid-Winooski Watershed Streams and Rivers
2021 Mid-Winooski Watershed Streams and Rivers
2019 Four Rivers Report
2018 Four Rivers Report
2017 Four Rivers Report
2016 Four Rivers Report
2015 Four Rivers Report
2010-2014 Available upon request
Chittenden County Stream Team
2015 CCST Report
2014 CCST Report
2013 CCST Report
2012 CCST Report